Page 257 - Social Enterprise A New Business Paradigm for Thailand
P. 257

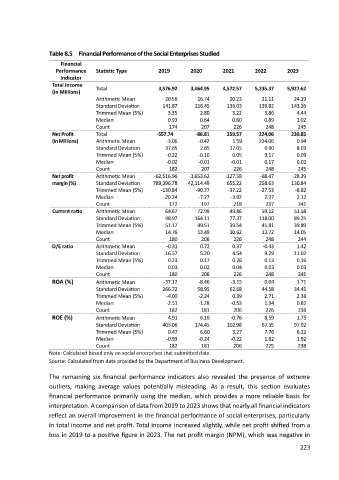
Table 8.5  Financial Performance of the Social Enterprises Studied

                      Financial
                     Performance   Statistic Type        2019       2020       2021        2022       2023
                      Indicator
                   Total Income
                                   Total                 3,576.92   3,464.95   4,572.57    5,235.37   5,927.62
                   (in Millions)
                                   Arithmetic Mean             20.56          16.74          20.23          21.11          24.19
                                   Standard Deviation        141.87         116.45         136.03         139.82         143.26
                                   Trimmed Mean (5%)             3.35            2.80            3.22            3.86            4.44
                                   Median                        0.93            0.64            0.80            0.89            1.02
                                   Count                    174         207        226        248         245
                   Net Profit      Total                -557.74       -86.81     359.57     224.06     230.85
                   (in Millions)   Arithmetic Mean         -3.06       -0.42       1.59     224.06       0.94
                                   Standard Deviation      37.65       2.65       17.05       0.90       8.03
                                   Trimmed Mean (5%)       -0.22       -0.10       0.05       9.17       0.09
                                   Median                  -0.02       -0.01      -0.01       0.17       0.02
                                   Count                    182         207        226        248         245
                   Net profit      Arithmetic Mean     -62,516.96    -3,653.62    -127.58    -68.47     -28.39
                   margin (%)      Standard Deviation   789,396.78   42,114.49   655.22     258.63     130.84
                                   Trimmed Mean (5%)      -130.84     -90.77     -37.22     -27.53       -8.82
                                   Median                  -20.24      -7.27      -3.92       2.37       2.12
                                   Count                    172         197        218        237         241
                   Current ratio    Arithmetic Mean        64.67      72.99       49.86      59.12      53.58
                                   Standard Deviation      98.97     164.11       77.37     118.00      89.25
                                   Trimmed Mean (5%)       51.17      49.51       39.54      41.81      39.89
                                   Median                  14.76      13.49       10.62      13.72      14.05
                                   Count                    180         206        226        248         244
                   D/E ratio       Arithmetic Mean         -0.31       0.72        0.37      -0.43       1.42
                                   Standard Deviation      16.57       5.20        4.54       9.29      11.02
                                   Trimmed Mean (5%)        0.23       0.17        0.26       0.13       0.16
                                   Median                   0.03       0.02        0.04       0.03       0.03
                                   Count                    180         206        226        248         245
                   ROA (%)         Arithmetic Mean         -37.12      -8.46      -3.15       0.04       1.71
                                   Standard Deviation     266.72      58.95       62.68      44.58      34.45
                                   Trimmed Mean (5%)       -4.00       -2.24       0.39       2.71       2.38
                                   Median                  -2.51       -1.28      -0.53       1.34       0.82
                                   Count                    182         181        206        226         238
                   ROE (%)         Arithmetic Mean          4.91       6.16       -0.76       8.59       1.75
                                   Standard Deviation     405.06     174.45      102.98      67.35      97.92
                                   Trimmed Mean (5%)        0.47       6.60        3.27       7.76       6.22
                                   Median                  -0.93       -0.24      -0.22       1.82       1.92
                                   Count                    182         181        206        225         238
                  Note: Calculated based only on social enterprises that submitted data.
                  Source: Calculated from data provided by the Department of Business Development.

                  The  remaining  six  financial  performance  indicators  also  revealed  the  presence  of  extreme
                  outliers,  making  average  values  potentially  misleading.  As  a  result,  this  section  evaluates
                  financial performance primarily using the median, which provides a more reliable basis for
                  interpretation. A comparison of data from 2019 to 2023 shows that nearly all financial indicators
                  reflect an overall improvement in the financial performance of social enterprises, particularly
                  in total income and net profit. Total income increased slightly, while net profit shifted from a

                  loss in 2019 to a positive figure in 2023. The net profit margin (NPM), which was negative in
                                                                                                          223
   252   253   254   255   256   257   258   259   260   261   262