
Page 259 - Social Enterprise A New Business Paradigm for Thailand
P. 259
more than 10% of the variance: total income, net profit, current ratio, and return on assets
(ROA). A summary of findings for each of these indicators is presented below.
8.7.1 Factors Predicting Total Income in Social Enterprises
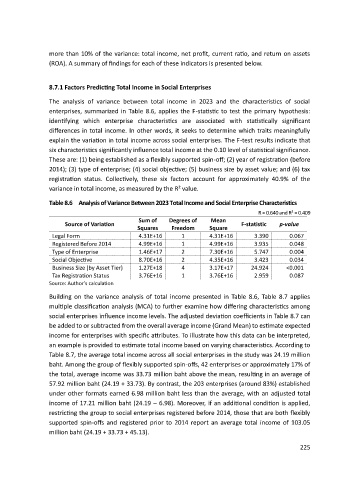
The analysis of variance between total income in 2023 and the characteristics of social
enterprises, summarized in Table 8.6, applies the F-statistic to test the primary hypothesis:
identifying which enterprise characteristics are associated with statistically significant
differences in total income. In other words, it seeks to determine which traits meaningfully
explain the variation in total income across social enterprises. The F-test results indicate that
six characteristics significantly influence total income at the 0.10 level of statistical significance.
These are: (1) being established as a flexibly supported spin-off; (2) year of registration (before
2014); (3) type of enterprise; (4) social objective; (5) business size by asset value; and (6) tax
registration status. Collectively, these six factors account for approximately 40.9% of the
variance in total income, as measured by the R² value.
Table 8.6 Analysis of Variance Between 2023 Total Income and Social Enterprise Characteristics
2
R = 0.640 and R = 0.409
Sum of Degrees of Mean
Source of Variation F-statistic p-value
Squares Freedom Square
Legal Form 4.31E+16 1 4.31E+16 3.390 0.067
Registered Before 2014 4.99E+16 1 4.99E+16 3.935 0.048
Type of Enterprise 1.46E+17 2 7.30E+16 5.747 0.004
Social Objective 8.70E+16 2 4.35E+16 3.423 0.034
Business Size (by Asset Tier) 1.27E+18 4 3.17E+17 24.924 <0.001
Tax Registration Status 3.76E+16 1 3.76E+16 2.959 0.087
Source: Author’s calculation
Building on the variance analysis of total income presented in Table 8.6, Table 8.7 applies
multiple classification analysis (MCA) to further examine how differing characteristics among
social enterprises influence income levels. The adjusted deviation coefficients in Table 8.7 can
be added to or subtracted from the overall average income (Grand Mean) to estimate expected
income for enterprises with specific attributes. To illustrate how this data can be interpreted,
an example is provided to estimate total income based on varying characteristics. According to
Table 8.7, the average total income across all social enterprises in the study was 24.19 million
baht. Among the group of flexibly supported spin-offs, 42 enterprises or approximately 17% of
the total, average income was 33.73 million baht above the mean, resulting in an average of
57.92 million baht (24.19 + 33.73). By contrast, the 203 enterprises (around 83%) established
under other formats earned 6.98 million baht less than the average, with an adjusted total
income of 17.21 million baht (24.19 – 6.98). Moreover, if an additional condition is applied,
restricting the group to social enterprises registered before 2014, those that are both flexibly
supported spin-offs and registered prior to 2014 report an average total income of 103.05
million baht (24.19 + 33.73 + 45.13).
225