
Page 254 - Social Enterprise A New Business Paradigm for Thailand
P. 254
8.5 Concentration of Total Revenue and Net Profit among Social
Enterprises
This section analyzes the concentration of total revenue and net profit among the studied social
enterprises from 2019 to 2023 using two indicators: the concentration ratio of the top four
enterprises (CR4) and the Gini coefficient (GC). As shown in Table 8.2, the number of enterprises
reporting revenue and profit rose steadily from 172 and 69 in 2019 to 241 and 138 in 2023.
Over this period, total revenue grew from 3,576.92 million baht to 5,927.62 million baht, and
net profit increased from 90.50 million baht to 348.46 million baht, reflecting average annual
growth rates of 13% and 40%, respectively. Both CR4 and GC show a decline in revenue
179
concentration , with CR4 dropping from 0.749 to 0.578 and GC from 0.933 to 0.924. For net
profit, although concentration fell in 2020, partly due to COVID-19’s impact on large enterprises,
especially those operating under the flexible spin-off model, this was not a lasting trend. Several
enterprises that had previously posted profits saw reduced earnings or shifted to losses. Still,
from 2019 to 2023, the CR4 for net profit declined from 0.659 to 0.582, suggesting a reduced
concentration among the top four enterprises. In contrast, GC for net profit rose from 0.807 to
0.889, indicating growing inequality in profit distribution. In other words, while the share of
profits among the top four declined, overall profit disparity across social enterprises increased,
signaling persistent unevenness in financial performance (see Table 8.2).
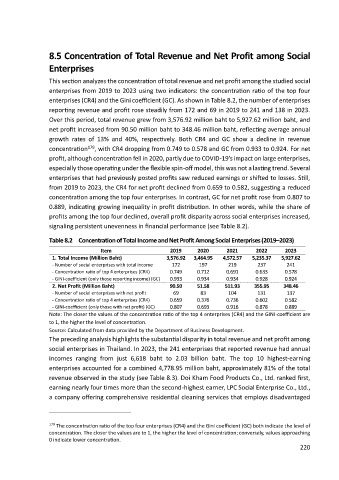
Table 8.2 Concentration of Total Income and Net Profit Among Social Enterprises (2019–2023)
Item 2019 2020 2021 2022 2023
1. Total Income (Million Baht) 3,576.92 3,464.95 4,572.57 5,235.37 5,927.62
- Number of social enterprises with total income 172 197 219 237 241
- Concentration ratio of top 4 enterprises (CR4) 0.749 0.712 0.691 0.633 0.578
- GINI-coefficient (only those reporting income) (GC) 0.933 0.934 0.934 0.928 0.924
2. Net Profit (Million Baht) 90.50 51.58 511.93 355.95 348.46
- Number of social enterprises with net profit 69 83 104 131 137
- Concentration ratio of top 4 enterprises (CR4) 0.659 0.376 0.736 0.602 0.582
- GINI-coefficient (only those with net profit) (GC) 0.807 0.693 0.916 0.878 0.889
Note: The closer the values of the concentration ratio of the top 4 enterprises (CR4) and the GINI-coefficient are
to 1, the higher the level of concentration.
Source: Calculated from data provided by the Department of Business Development.
The preceding analysis highlights the substantial disparity in total revenue and net profit among
social enterprises in Thailand. In 2023, the 241 enterprises that reported revenue had annual
incomes ranging from just 6,618 baht to 2.03 billion baht. The top 10 highest-earning
enterprises accounted for a combined 4,778.95 million baht, approximately 81% of the total
revenue observed in the study (see Table 8.3). Doi Kham Food Products Co., Ltd. ranked first,
earning nearly four times more than the second-highest earner, LPC Social Enterprise Co., Ltd.,
a company offering comprehensive residential cleaning services that employs disadvantaged
179 The concentration ratio of the top four enterprises (CR4) and the Gini coefficient (GC) both indicate the level of
concentration. The closer the values are to 1, the higher the level of concentration; conversely, values approaching
0 indicate lower concentration.
220