
Page 80 - Social Enterprise A New Business Paradigm for Thailand
P. 80
Among religious organizations, 47,593 were found to rely on or receive donations, representing
98.64% of all organizations in that category. This was the highest donation-receiving rate across
all organization types. The second-highest rate was found among educational organizations, with
92.84% receiving donations. Thus, religious organizations, most of which are temples, constitute
the largest segment of nonprofit entities in Thailand that receive public donations, when
measured by the proportion of recipient organizations.
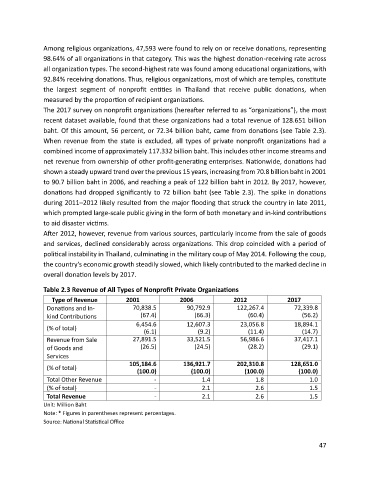
The 2017 survey on nonprofit organizations (hereafter referred to as “organizations”), the most
recent dataset available, found that these organizations had a total revenue of 128.651 billion
baht. Of this amount, 56 percent, or 72.34 billion baht, came from donations (see Table 2.3).
When revenue from the state is excluded, all types of private nonprofit organizations had a
combined income of approximately 117.332 billion baht. This includes other income streams and
net revenue from ownership of other profit-generating enterprises. Nationwide, donations had
shown a steady upward trend over the previous 15 years, increasing from 70.8 billion baht in 2001
to 90.7 billion baht in 2006, and reaching a peak of 122 billion baht in 2012. By 2017, however,
donations had dropped significantly to 72 billion baht (see Table 2.3). The spike in donations
during 2011–2012 likely resulted from the major flooding that struck the country in late 2011,
which prompted large-scale public giving in the form of both monetary and in-kind contributions
to aid disaster victims.
After 2012, however, revenue from various sources, particularly income from the sale of goods
and services, declined considerably across organizations. This drop coincided with a period of
political instability in Thailand, culminating in the military coup of May 2014. Following the coup,
the country’s economic growth steadily slowed, which likely contributed to the marked decline in
overall donation levels by 2017.
Table 2.3 Revenue of All Types of Nonprofit Private Organizations
Type of Revenue 2001 2006 2012 2017
Donations and In- 70,838.5 90,792.9 122,267.4 72,339.8
kind Contributions (67.4) (66.3) (60.4) (56.2)
6,454.6 12,607.3 23,056.8 18,894.1
(% of total)
(6.1) (9.2) (11.4) (14.7)
Revenue from Sale 27,891.5 33,521.5 56,986.6 37,417.1
of Goods and (26.5) (24.5) (28.2) (29.1)
Services
105,184.6 136,921.7 202,310.8 128,651.0
(% of total)
(100.0) (100.0) (100.0) (100.0)
Total Other Revenue - 1.4 1.8 1.0
(% of total) - 2.1 2.6 1.5
Total Revenue - 2.1 2.6 1.5
Unit: Million Baht
Note: * Figures in parentheses represent percentages.
Source: National Statistical Office
47